At Datanoids, we take pride in delivering cutting-edge data solutions, showcased through a diverse portfolio of successful projects. Our expertise spans cross-tabulation from multiple tools, the creation of dynamic dashboards using PowerBI and Tableau, and the development of interactive simulators for client engagement. We specialize in custom scripting using advanced web technologies for interactive client-side experiences. Our projects also include live-streaming dashboards, combining real-time data with seamless visualizations. Behind each solution lies meticulous data validation, cleaning, and powerful scripting using Excel macros, Python, and R, ensuring that every project maximizes the potential of your data to its fullest.
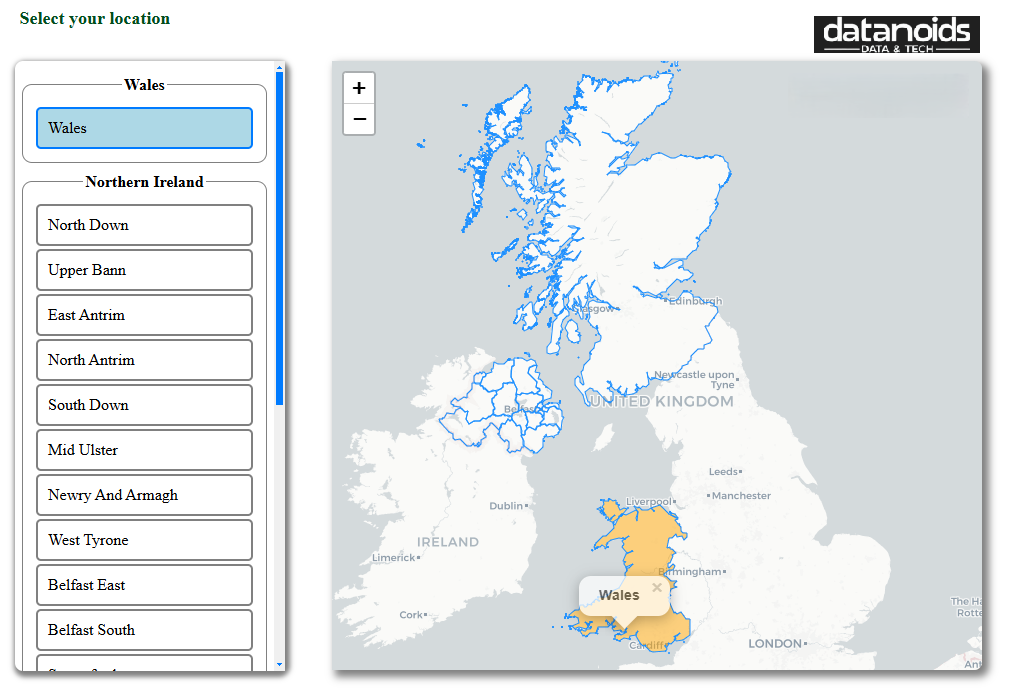
Map-based interactive survey question where users interact with a map to select regions, enhancing engagement and data accuracy. To optimize usability, you ensured the regions panel appears only on mobile to avoid screen clutter

This page is from our PowerBI project, where we developed a dynamic dashboard featuring multiple tiles, data visualizations, and charts on a single screen. Additionally, we incorporated drill-down options to provide deeper insights and forecast future trends.

Heatmaps, visually represent user preferences, offering valuable insights into image engagement and interaction patterns. This is an example of processed "like" and "dislike" click data used to generate heatmaps of the provided images, created by our Python collaborators.
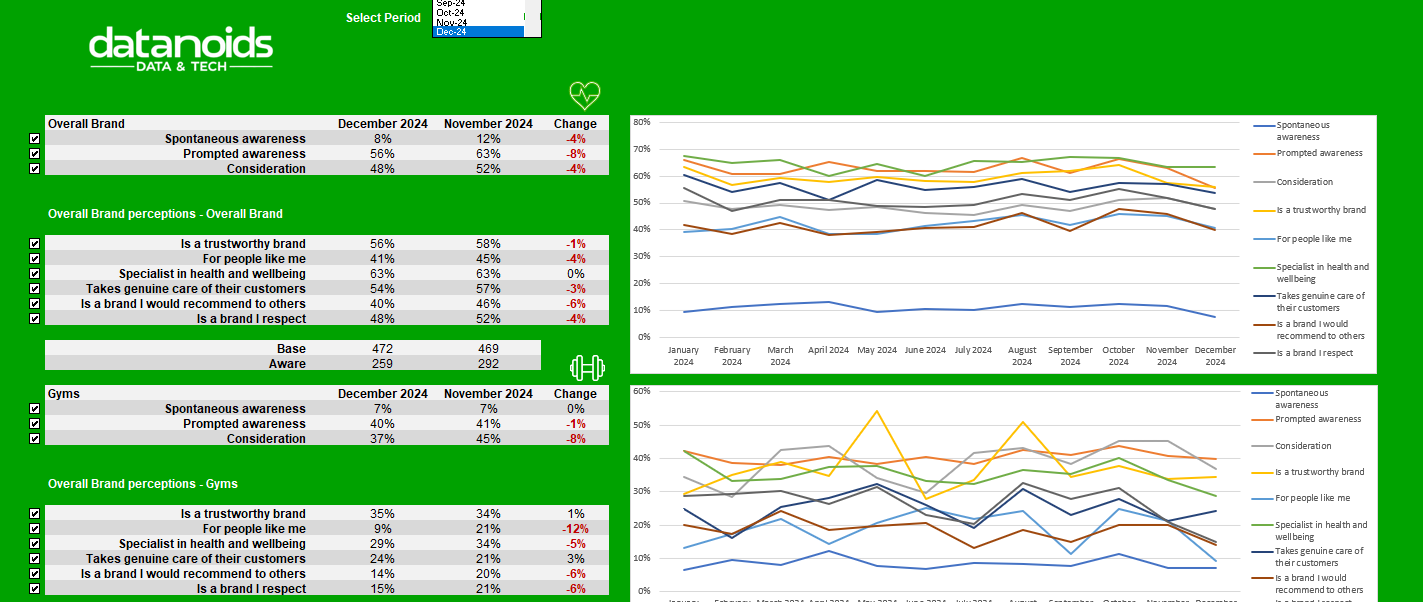
Functional simulator, where cross-tabs display comparisons between the selected month and the previous month. Simultaneously, charts visualize data from the past 12 months, offering deeper insights. Multiple user functions are also available on the same page for enhanced interactivity.
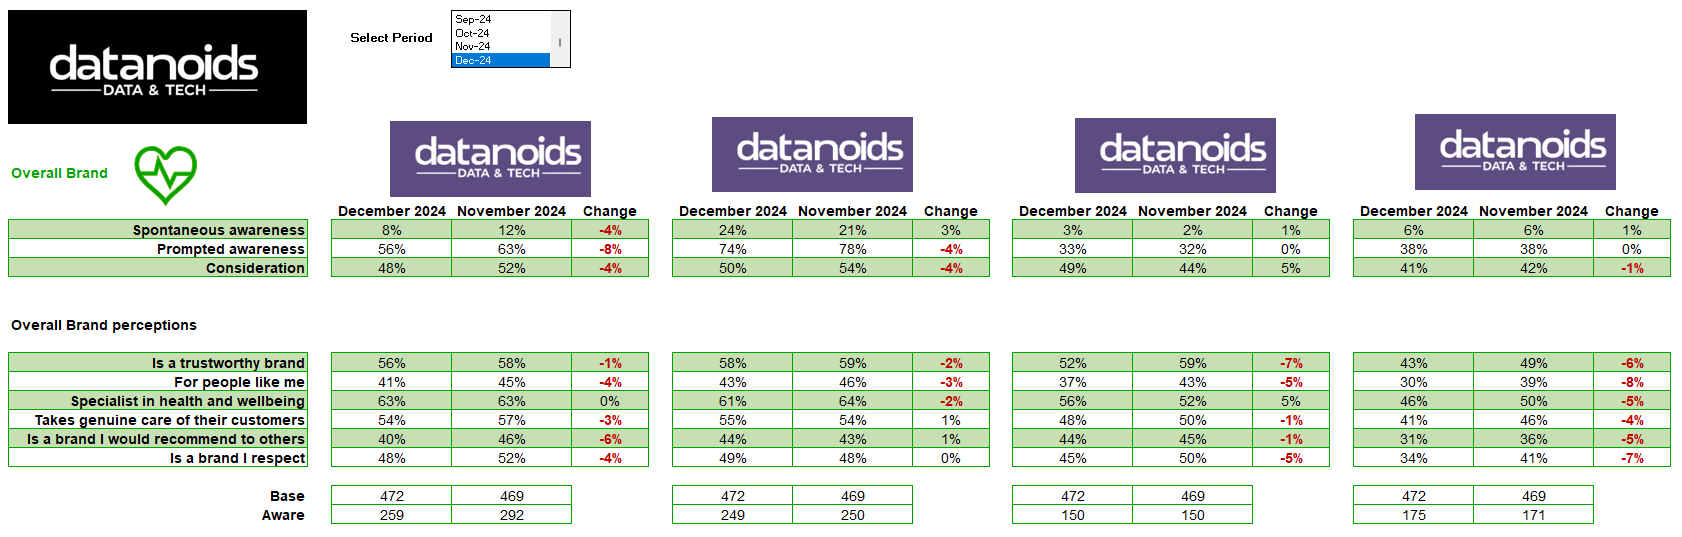
This functional Excel simulator acts as a monthly tracker, consolidating all data to date. It provides month-on-month comparisons for the selected and previous month, highlighting key performance indicators (KPIs) for both target and competitor brands.
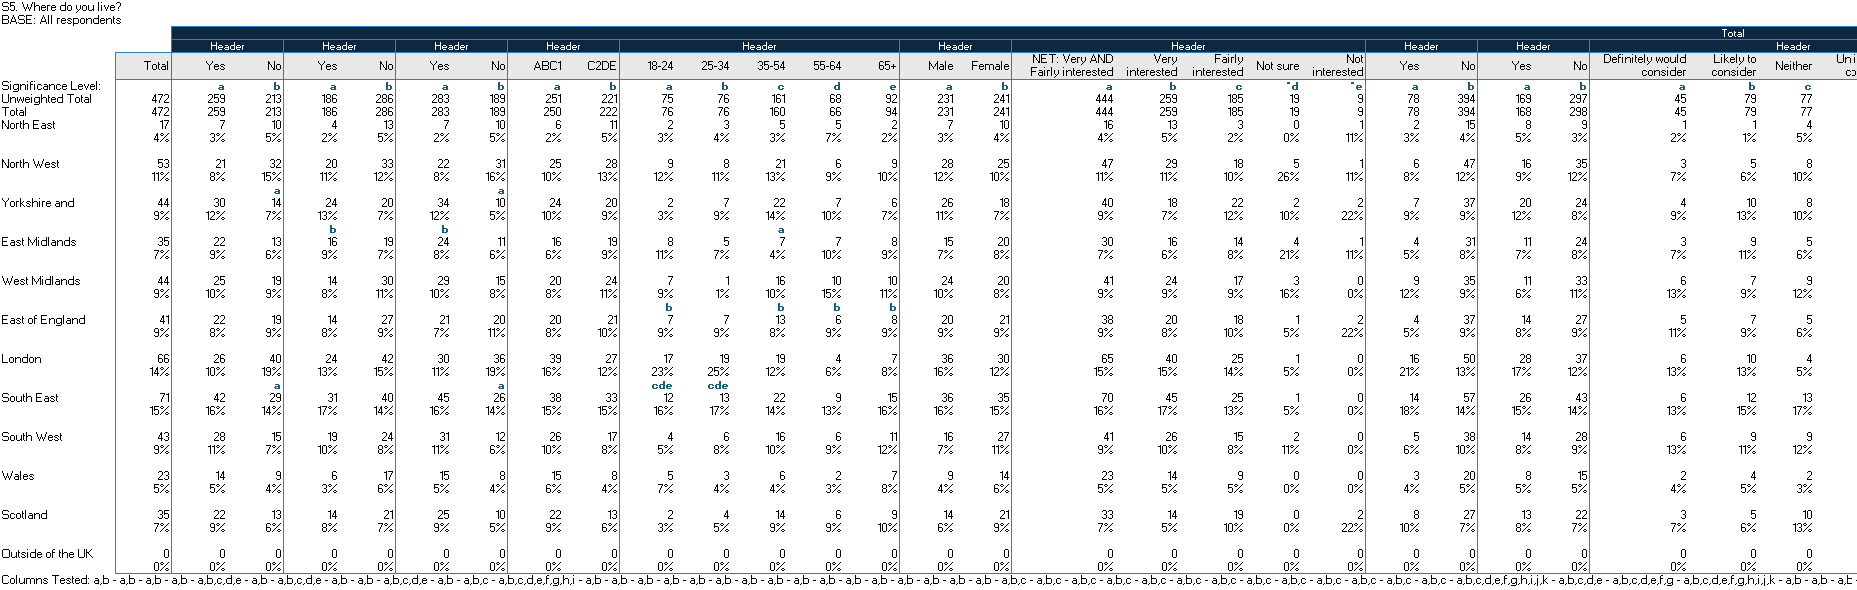
We specialize in creating cross-tables, including tabulation specifications and weighting requirements. Our team is proficient in utilizing a wide range of market-leading tools, such as Merlin, Quantum, Dimensions, WinCross, and Uncle to ensure comprehensive data analysis and reporting.
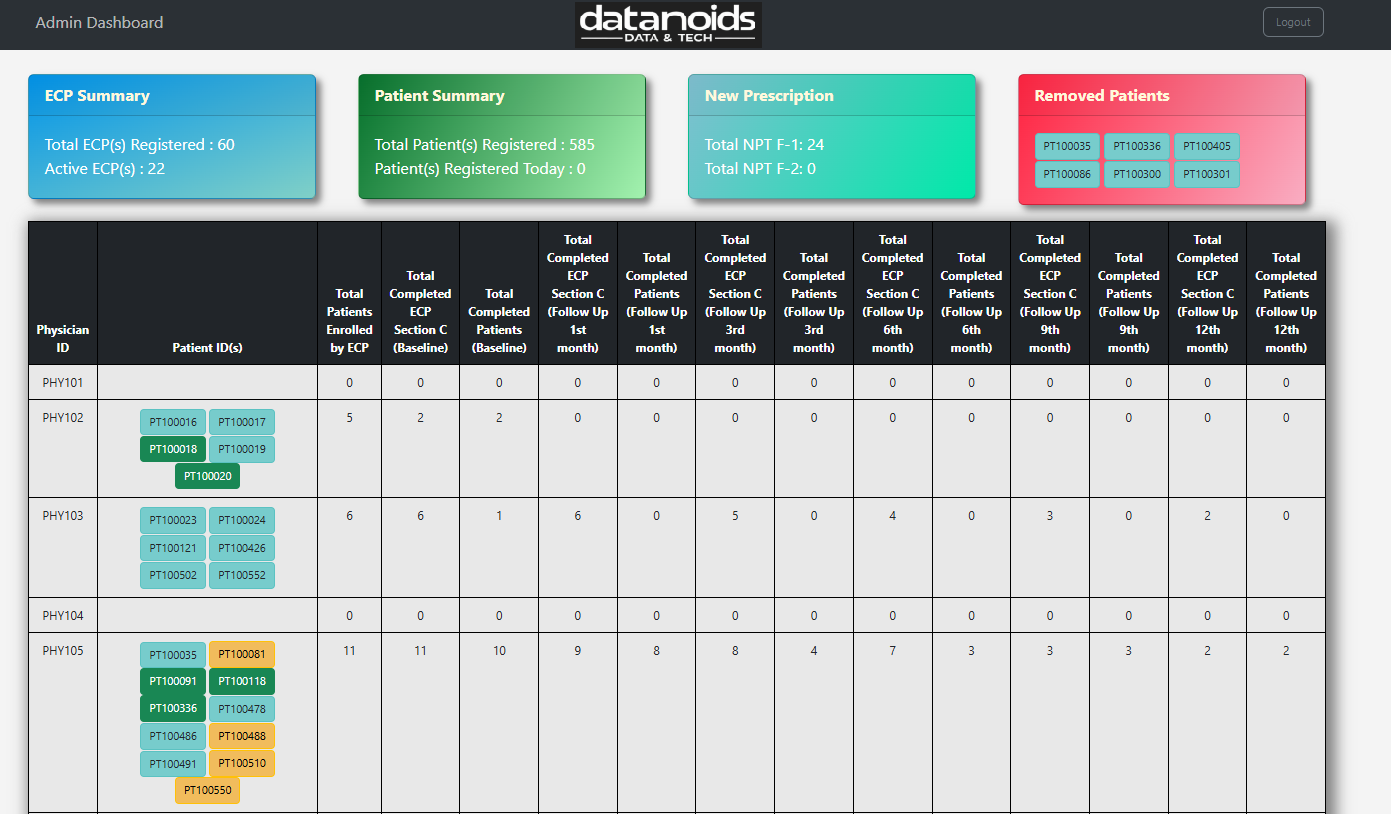
Dashboard The Admin module provided centralized control, allowing administrators to manage surveys, user roles, and data flows. It ensured seamless access to survey analytics, progress tracking, and system configurations, empowering decision-makers with real-time insights into physician and patient engagement. The goal of this module was to establish an additional layer of oversight for physicians while enabling administrators to take necessary actions within the platform.
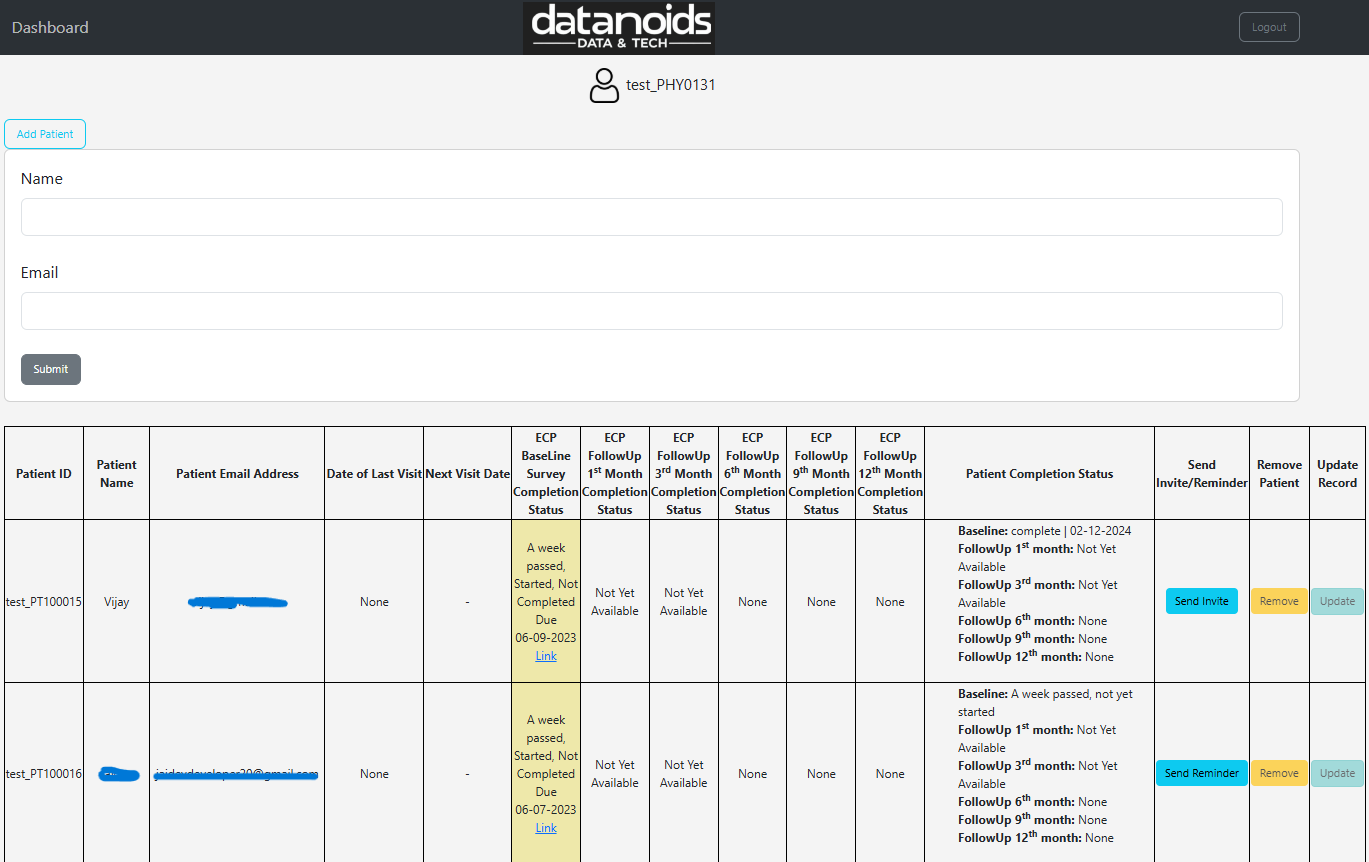
Dashboard The ECP (Expert Care Provider) module was designed to streamline survey management for healthcare professionals. It enabled physicians to track multiple patient surveys in real-time, initiate new surveys, and send invitations directly from the dashboard. Integrated with Decipher, it bridged the gap by offering a centralized system for monitoring patient responses, ensuring seamless data collection and improved healthcare insights.